Can AI agent find the best place to visit in the commercial district? - Deep Reinforcement learning approach
Introduction to Itaewon Instagram contents map
Before visiting regions, we routinely visit restaurants and cafes after searching reviews of social media and visit the store that is expected to give you the highest satisfaction through a search. But is it really the best choice to visit the shop using the results of a search? If the store I found was once famous or if I didn’t search enough, I wouldn’t be able to find the most famous store in the region. Rather than spending more time on the Internet to find the best place to visit, I think we can solve this problem if we know the distribution of online popularity throughout commercial districts.
This map expresses the Instagram popularity of Itaewon commercial district which is located in Itaewon(Map 1, Map 2), Yongsan-gu, Seoul, South Korea. It is one of representative business district in Seoul. Also not only represent Instagram distribution, but trained the agent which visited the area based on the Instagram popularity using deep reinforcement learning(Map 3). At first an agent randomly interacted with the map, however, after simulation, agent could finally learn the opimized policy to find the most famous areas based on given data. To make this map, 20 computers were parallelized to collect Instagram data. Store names in Itaewon region were used as queries for search on Instagram and parsed information. Through this process, Instagram contents that occurred between January 1, 2013 and August 19, 2019 (approximately 2167 days) were saved in the database.
[Map 1] represented Instagram contents that were generated on August 19, 2019, the last day contents were collected. It is hard to find the trend of overall online popularity in the Itaewon commercial districts if only data at a certain point in time is used. To find timeseries trend in the Itaewon area, spatiotemporal distribution of the Instagram contents in the Itaewon commercial district was expressed in [Map 2]. In 2013, when Instagram was launched in Korea, little contents were created in Itaewon area, but as it goes to August 2019, it can be seen that contents were generated throughout Itaewon.
In particular, the distribution of contents can identify the active areas in the region at certain time. In addition to describe the popularity distribution on the Itaewon area, I trained artificial intelligence that can support spatial decisions by utilizing data. Instagram contents are spatiotemporal data that have a significant impact on the floating population(Jang, et.al, 2020)
The Instagrm data which are heterogeneously distributed in the area was converted into the learning environment, and the agent which interacted with the environment were trained using deep reinforcement learning. As a result of the study, we were able to train the agent who learned the optimal policy of visiting the most famous area.[Map 3]
Map 1 : Itaewon Instagram contents map(Static Map)
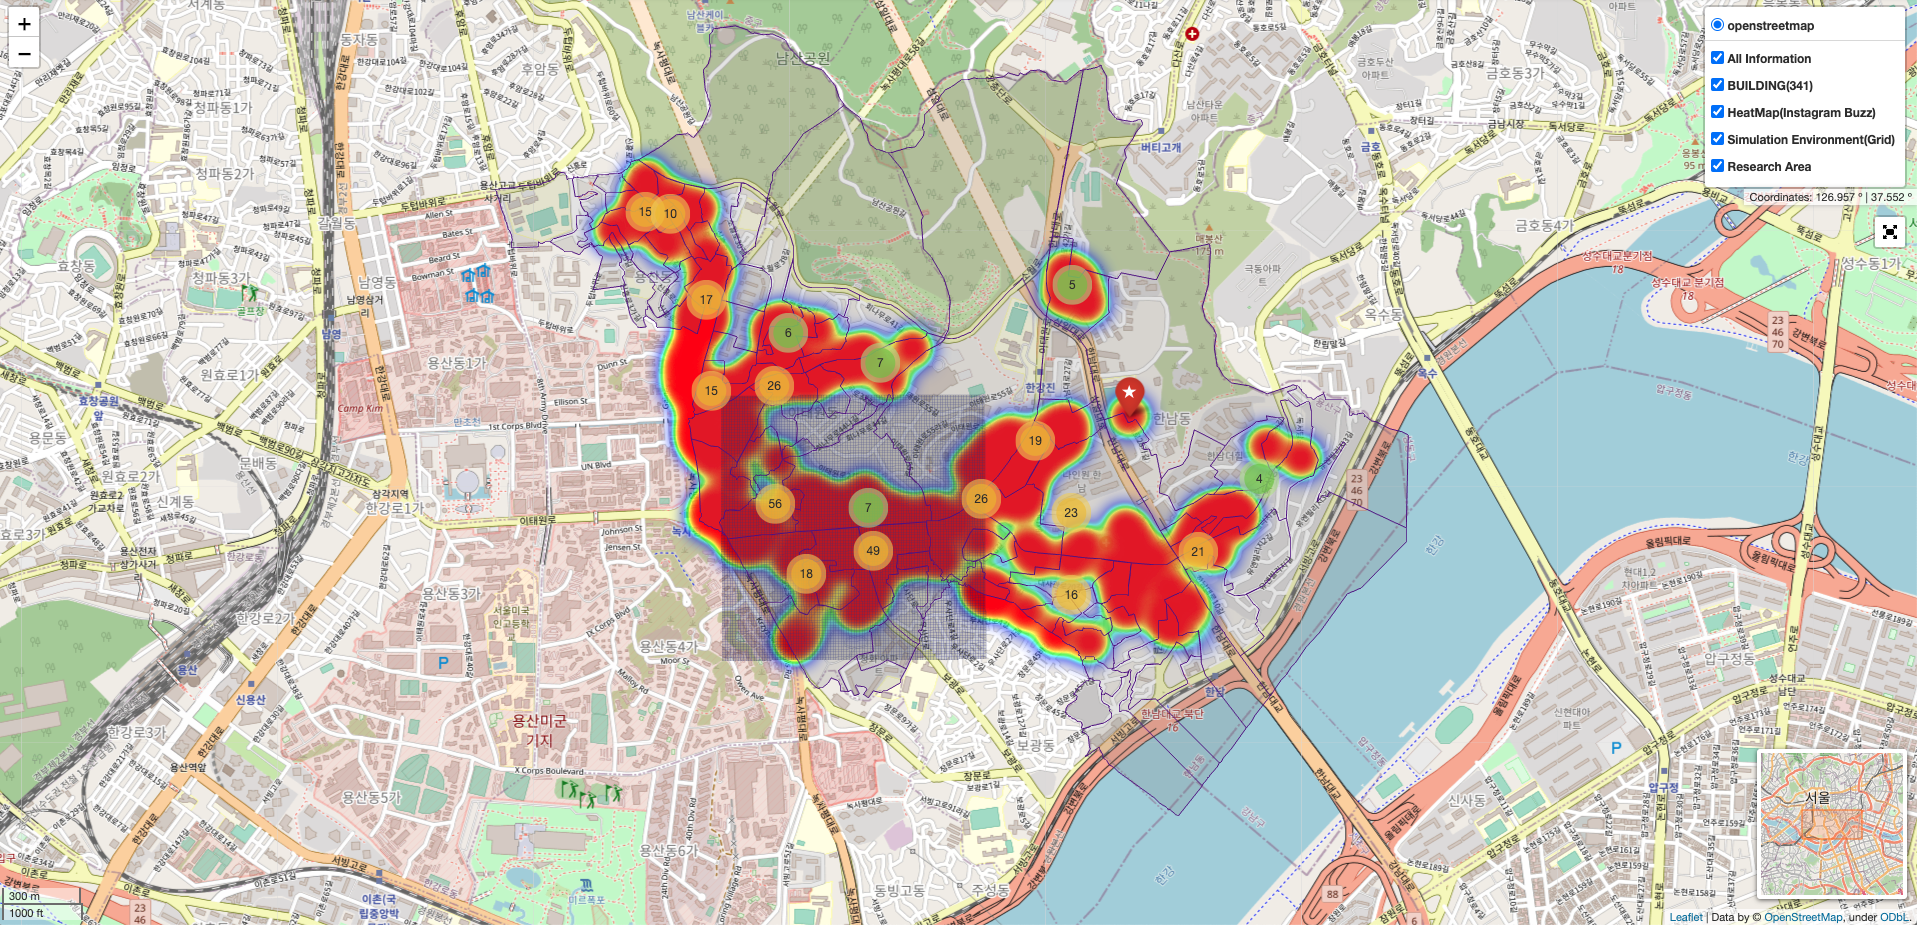
- Colors range from blue to red
- Blue color represents the most lowest frequency, on the other hand red color represents the most highest frequency
[Map 1] shows Instagram data, store locations, research area, and simulation scope data on the map.
- HeatMap (Instagram Buzz) layer: Instagram data is displayed in HeatMap (Instagram Buzz) layer. It was expressed in HeatMap to see the relative distribution of Instagram contents within the Itaewon district. Blue color represents the most lowest frequency, on the other hand red color represents the most highest frequency
- BUILDING (341) layer: The location of stores in Itaewon area can be found in BUILDING (341) layer. A total of 341 shops are displayed in research areas. Markers are marked on the coordinates where the store is located, and you can check the total number of “accumulated” Instagram contents by clicking on them.
- Simulation Environment (Grid) Layer: Simulation Environment (Grid) Layer indicates the environment in which deep reinforcement learning is applied. Around Itaewon Station, the range of 1000㎡ was used as the simulation environment, and the environment of 1,000㎡ consisted of 10,000 grids(10㎡).
- Research Area layer: Research Area layer indicates the research area which consist of three administrative areas(Yongsan-dong 2-ga, Itaewon-dong, Hannam-dong) where Itaewon commercial districts are formed.
Map 2 : Itaewon Instagram contents map(Dynamic Map)
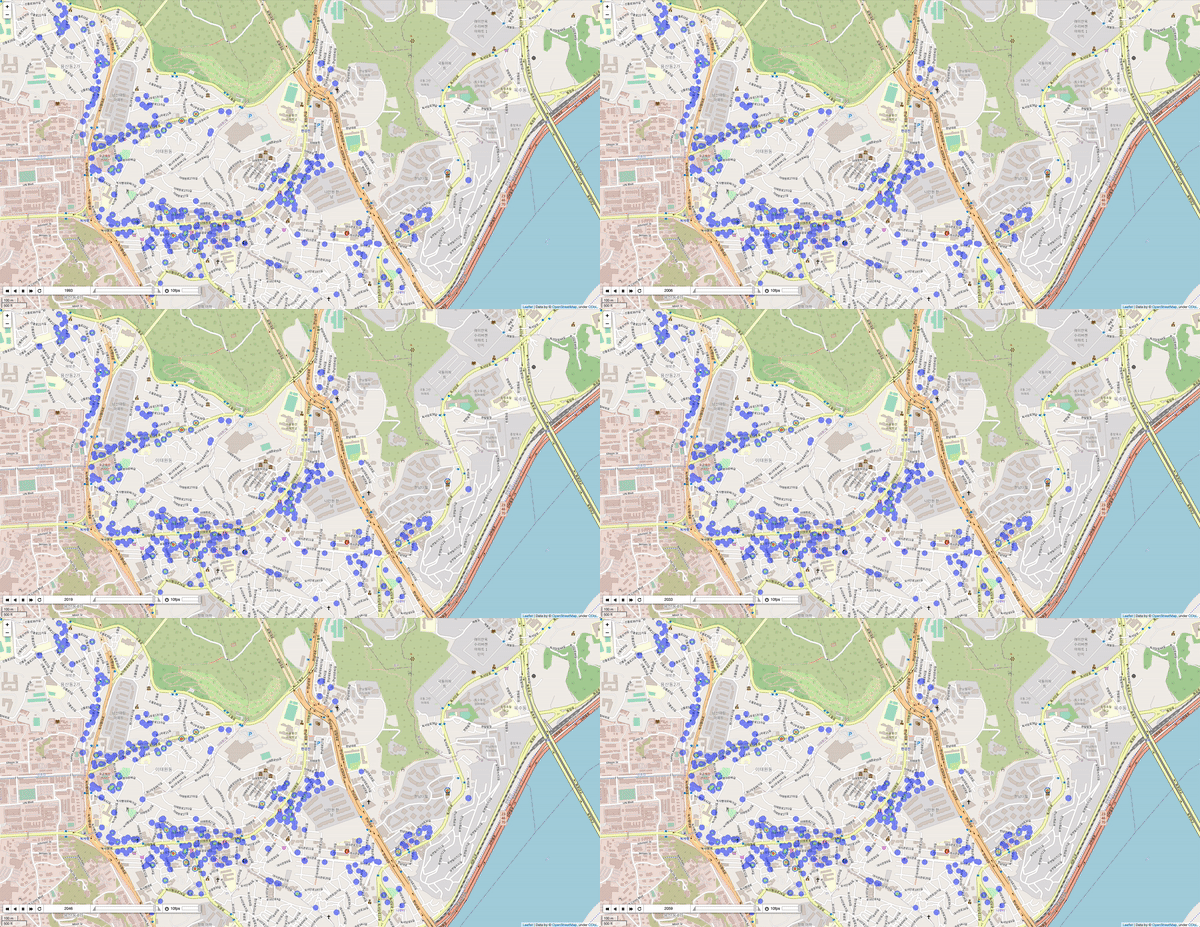
- Colors range from blue to red
- Blue color represents the most lowest frequency, on the other hand red color represents the most highest frequency
[Map 2] has a chronological display of Instagram contents that were generated between January 1, 2013 and August 19, 2019. The cumulative sum of contents by region was expressed in order of time to identify the activated areas of the Itaewon commercial district. The distribution of contents allows us to identify the active areas at a specific point in time.
Map 3 : Deep Reinforcement learning simulation result(dynamic map)
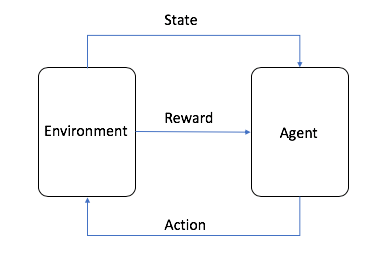
The process in which the reinforcement learning agent proceeds learning is as shown in the image above. The agent selects an action according to the state of the environment and receives a reward from the environment based on the action.

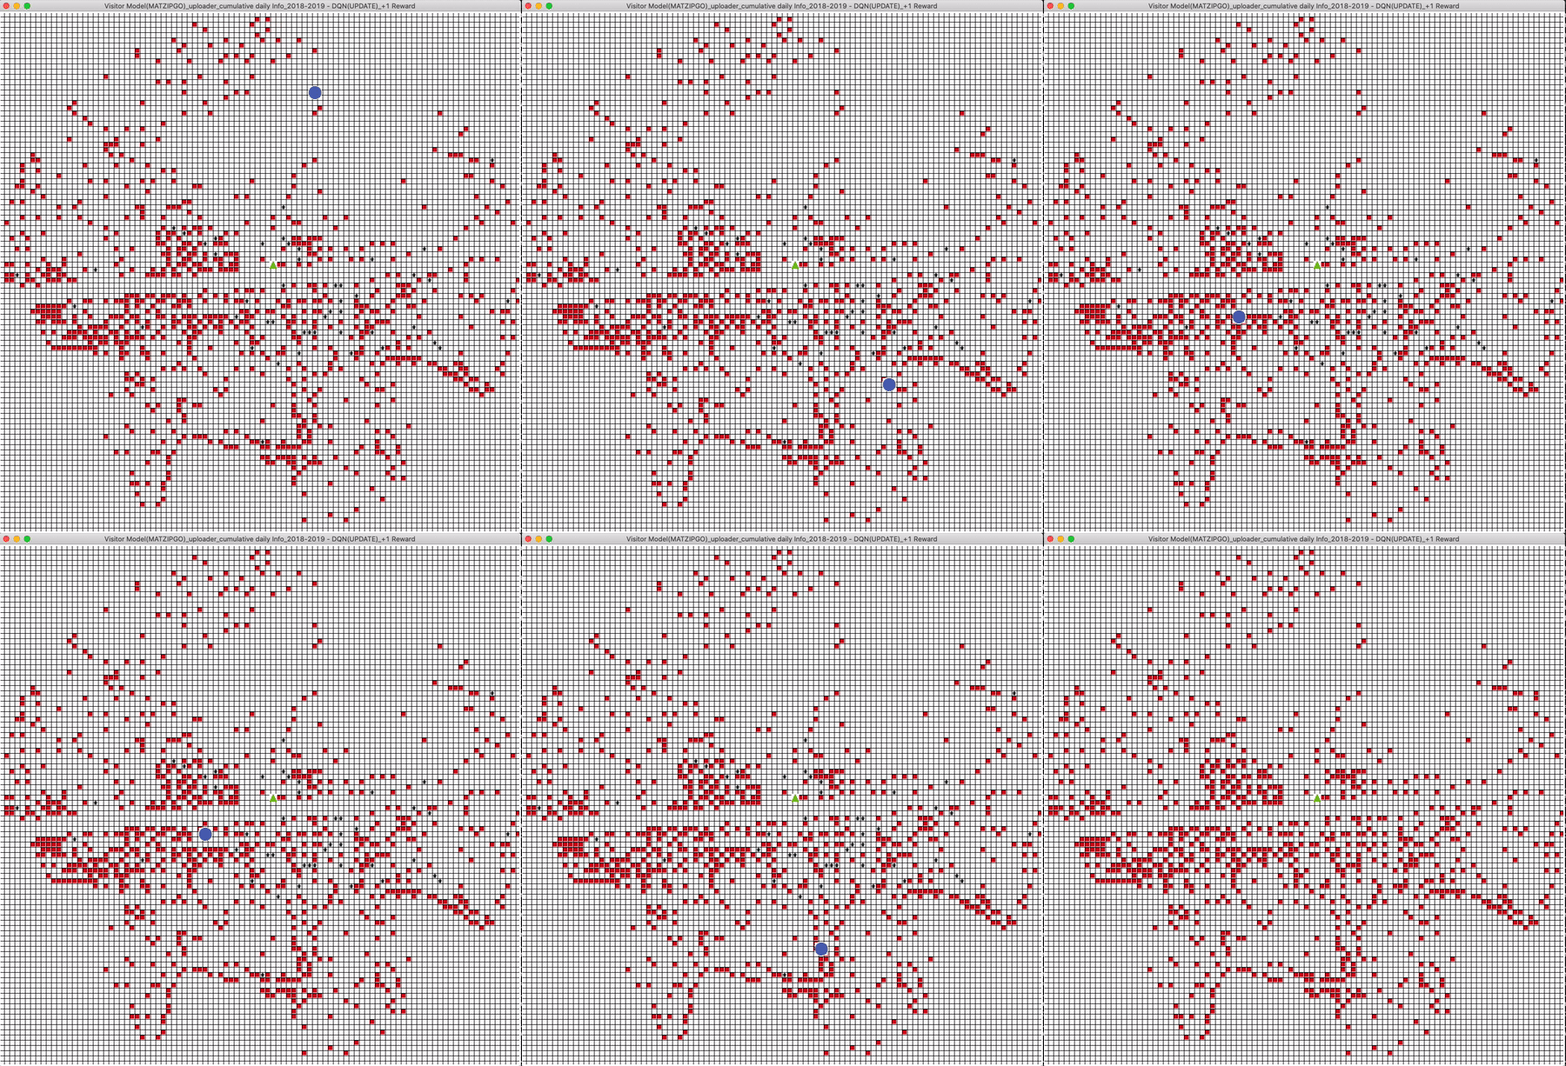
- circle : Agent who is interacting with the environment
- Red grid : Red grids represent the place where shops are located
[Map 3] demonstrates the process of training using deep reinforcement learning. In deep reinforcement learning simulation, agent receives high rewards for visiting areas with a lot of Instagram content, otherwise they will not be rewarded. Through learning, the agent derives the optimal policy of visiting the most famous area in Itaewon. As can be seen in Map 1’s ‘Simulation Environment (Grid) Layer’, a grid environment was formed to respond to the actual space range, and Instagram contents that occured in areas corresponding to the space range of each grid were aggregated into each grid.
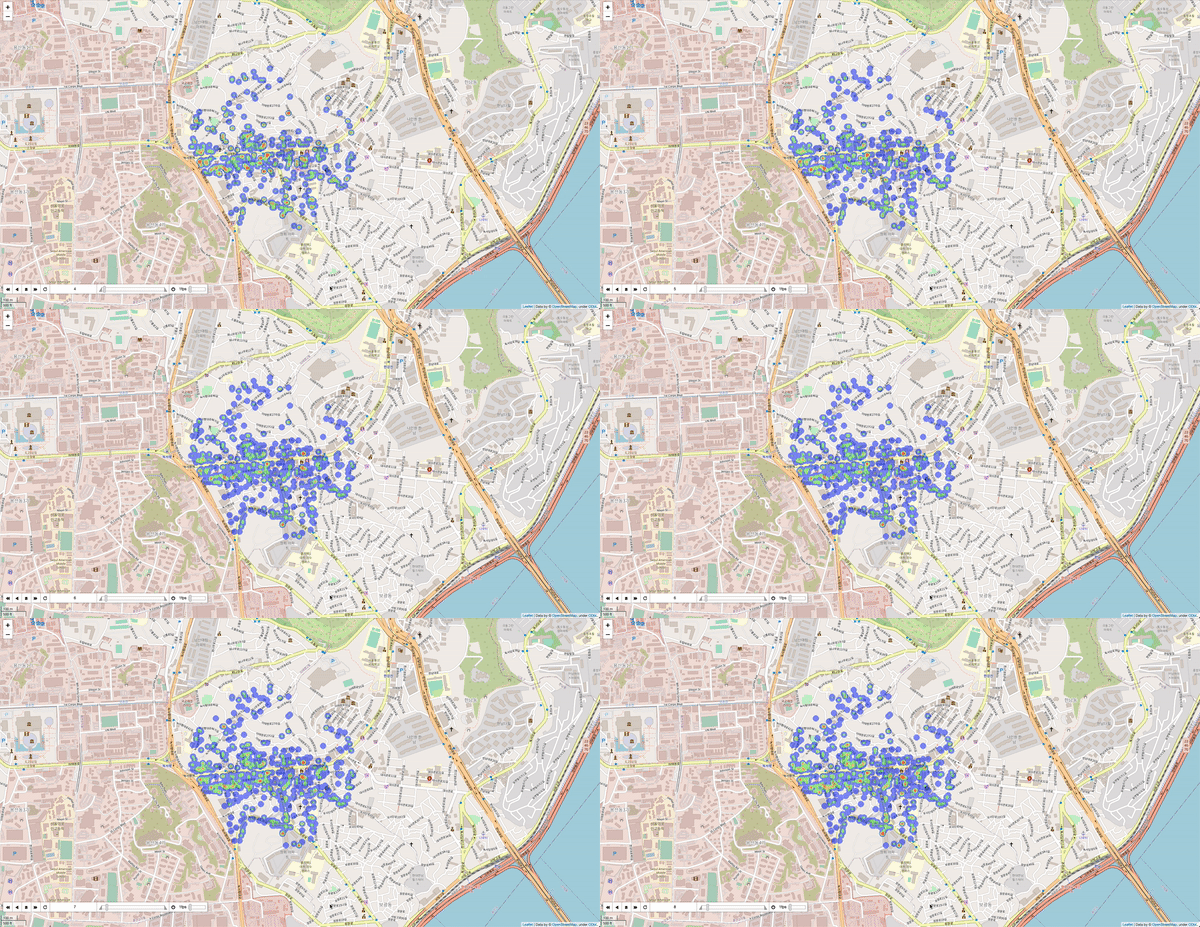
- Colors range from blue to red
- Blue color represents the most lowest frequency, on the other hand red color represents the most highest frequency
- The most visited areas become red and relatively the least visited areas become blue
The results of simulation between August 2018 and August 2019 are as shown in Map 3. It is possible to check the frequency of agent’s visits according to simulation. Areas which were highly visited by agent were shown red in Heatmap, otherwise blue. Agent visited all regions at random in the early stages of learning, but as learning progressed, it can learn the policy of visiting famous areas, and consequently converged into the areas where the highest rewards can be obtained.
Based on the results of Itaewon Instagram Contents Map, visitors to the commercial district can plan an optimal plan to visit an area where famous shops inside the commercial district are clustered. It is also expected to provide useful information to small business owners who operate businesses in local commercial districts. We can see how active commercial districts are at a certain point in time, and we can also use trained agent to predict areas which will be popular in the future. It is expected that this research will be used to help make spatial decisions for small business owners such as extending store contracts and selecting new store locations. Furthermore, we look forward to the possibility of developing the vanishing process of stores due to higher rents, which can predict and respond to gentrification in future researches.
- This post is based on the papers below
(in progress) Jang, J., & Choi, J. (2020). Predicting pedestrian behaviors in Itaewon commercial district using user generated contents : deep reinforcement learning approach.
Jang, J. (1st author), Kim, M., Choi, J., (2020), A Study on the Relationship between Foot Traffic and Instagram Contents Using Spatial Panel Model, Korea Society for Geospatial Information Science (in Korean with English abstract) (Jang, et.al, 2020)